Semi-Final Speed Comparison spreadsheet
by Andrew Wilson on 1 Jun 2007
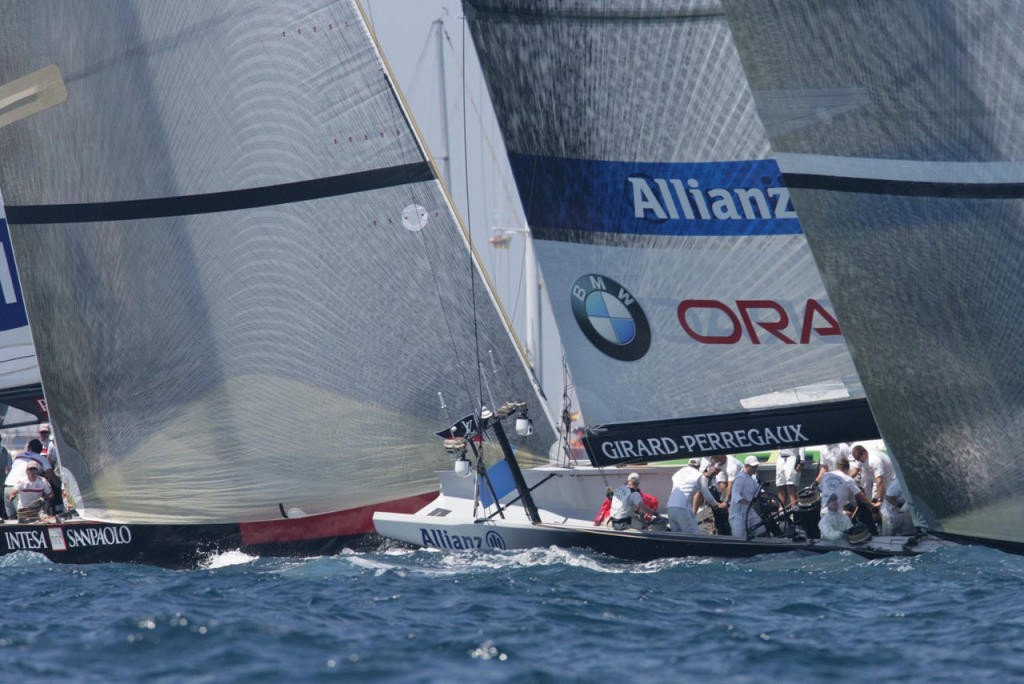
BMW ORACLE Racing v Luna Rossa Challenge. Semi-final Louis Vuitton Cup BMW Oracle Racing Photo Gilles Martin-Raget
http://www.bmworacleracing.com
Sail-World reader Andrew Wilson has analysed the relative performances of the Louis Vuitton Cup Semi-Finalists and has extended this into an insight of what we can maybe expect to see in the finals of the Louis Vuitton Cup
He concludes:
Upwind ETNZ's boatspeed was 0.09kn faster upwind than Luna Rossa, although L.R. reached the top mark 26 seconds earlier,(or about 5 boat lengths) however ETNZ had an average of 3.25 extra tacks per leg (42% more) and seemed to cover and attack more.
Downwind ETNZ's boatspeed was 0.14kn slower downwind than Luna Rossa with L.R. completing an average of 2.2 (43%) more gybes per leg, however all four boats were only separated in avg. downwind leg time by 4 seconds (less than a boat length) possibly suggesting different pointing angles and more even VMG's (Velocity Made Good, i.e.- Speed toward the Mark)
| Who is Quicker??? - Emirates TNZ vs. Luna Rossa |
| Semi Finalists Statistical Comparisons |
| 23/05/07 - by Andrew Wilson |
| andrew@partform.co.nz |
| ph: +64274060142 |
|
|
|
|
|
|
|
|
|
|
|
|
|
|
|
|
|
|
|
|
|
|
|
|
|
| Note: While These statistics are an interesting comparison of speed averaged over 6 Semi Final races, they cannot be relied upon as a truly accurate indicator |
| of relative speed due to differences in windspeed, upwind and downwind pointing ability, number of tacks / gybes and tactical sailing manoeuvres. |
| However, as these Semi Final races were sailed on the same courses starting within 10mins of each other, the wind and sea conditions should be similar and |
| the greater the number of races sampled, the more accurate the averages should be. Data was accumulated and interpreted from published Americas Cup Management Race Timing Sheets |
| …statistics don't lie, interpretations do!... |
|
|
|
|
|
|
|
|
|
|
|
|
|
|
|
|
|
|
|
|
|
|
|
|
|
|
Emirates TNZ |
|
|
Luna Rossa |
|
|
|
|
Oracle BMW |
|
Desafio Espanol |
| Race 6 |
|
|
|
|
|
|
|
|
|
|
|
|
Race 6 |
|
|
|
|
|
|
|
|
|
|
|
| MARK |
Elapsed Time |
Leg Time |
Avg. Speed |
Tacks/Gybes |
Wind |
|
Elapsed Time |
Leg Time |
Avg. Speed |
Tacks/Gybes |
Wind |
|
MARK |
Elapsed Time |
Leg Time |
Avg. Speed |
Tacks/Gybes |
Wind |
|
Elapsed Time |
Leg Time |
Avg. Speed |
Tacks/Gybes |
Wind |
| Start |
0:04 |
- |
- |
- |
|
|
0:02 |
- |
- |
- |
|
|
Start |
0:01 |
- |
- |
- |
|
|
0:02 |
- |
- |
- |
|
| 1st Windward |
25:19 |
25:15 |
9.4 |
10 |
12 |
|
24:31 |
24:29 |
9.4 |
9 |
13 |
|
1st Windward |
25:03 |
25:02 |
9.3 |
10 |
13 |
|
25:07 |
25:05 |
9.5 |
10 |
12 |
| 1st Leeward |
42:54 |
17:35 |
11 |
2 |
15 |
|
41:23 |
16:52 |
11.8 |
4 |
14 |
|
1st Leeward |
41:55 |
16:52 |
11.7 |
5 |
14 |
|
42:41 |
17:34 |
11 |
2 |
15 |
| 2nd Windward |
65:39 |
22:45 |
9.7 |
10 |
15 |
|
63:49 |
22:26 |
9.5 |
8 |
15 |
|
2nd Windward |
64:24 |
22:29 |
9.6 |
7 |
15 |
|
65:31 |
22:50 |
9.6 |
8 |
15 |
| Finish |
84:48 |
19:09 |
10.7 |
1 |
14 |
|
82:34 |
18:45 |
11.6 |
9 |
13 |
|
Finish |
83:07 |
18:43 |
11.7 |
9 |
13 |
|
84:33 |
19:02 |
10.7 |
1 |
14 |
|
|
|
|
|
|
|
|
|
|
|
|
|
|
|
|
|
|
|
|
|
|
|
|
|
| Race 5 |
|
|
|
|
|
|
|
|
|
|
|
|
Race 5 |
|
|
|
|
|
|
|
|
|
|
|
| MARK |
Elapsed Time |
Leg Time |
Avg. Speed |
Tacks/Gybes |
Wind |
|
Elapsed Time |
Leg Time |
Avg. Speed |
Tacks/Gybes |
Wind |
|
MARK |
Elapsed Time |
Leg Time |
Avg. Speed |
Tacks/Gybes |
Wind |
|
Elapsed Time |
Leg Time |
Avg. Speed |
Tacks/Gybes |
Wind |
| Start |
0:03 |
- |
- |
- |
|
|
0:24 |
- |
- |
- |
|
|
Start |
0:14 |
- |
- |
- |
|
|
0:04 |
- |
- |
- |
|
| 1st Windward |
27:05 |
27:02 |
9.2 |
19 |
10 |
|
26:33 |
26:09 |
9.2 |
12 |
8 |
|
1st Windward |
26:58 |
26:44 |
9.1 |
16 |
8 |
|
27:40 |
27:36 |
9.2 |
21 |
10 |
| 1st Leeward |
49:18 |
22:13 |
9.6 |
4 |
8 |
|
47:43 |
21:10 |
10 |
8 |
8 |
|
1st Leeward |
48:31 |
21:33 |
10.1 |
7 |
8 |
|
50:13 |
22:33 |
9.6 |
5 |
8 |
| 2nd Windward |
77:14 |
27:56 |
8.7 |
12 |
7 |
|
74:41 |
26:58 |
8.9 |
8 |
6 |
|
2nd Windward |
75:35 |
27:04 |
8.9 |
9 |
6 |
|
78:29 |
28:16 |
8.8 |
11 |
7 |
| Finish |
103:42 |
26:28 |
8.8 |
4 |
8 |
|
101:18 |
26:37 |
9 |
5 |
7 |
|
Finish |
103:15 |
27:40 |
9 |
7 |
7 |
|
105:31 |
27:02 |
8.7 |
4 |
8 |
|
|
|
|
|
|
|
|
|
|
|
|
|
|
|
|
|
|
|
|
|
|
|
|
|
| Race 4 |
|
|
|
|
|
|
|
|
|
|
|
|
Race 4 |
|
|
|
|
|
|
|
|
|
|
|
| MARK |
Elapsed Time |
Leg Time |
Avg. Speed |
Tacks/Gybes |
Wind |
|
Elapsed Time |
Leg Time |
Avg. Speed |
Tacks/Gybes |
Wind |
|
MARK |
Elapsed Time |
Leg Time |
Avg. Speed |
Tacks/Gybes |
Wind |
|
Elapsed Time |
Leg Time |
Avg. Speed |
Tacks/Gybes |
Wind |
| Start |
0:04 |
- |
- |
- |
|
|
0:02 |
- |
- |
- |
|
|
Start |
0:03 |
- |
- |
- |
|
|
0:08 |
- |
- |
- |
|
| 1st Windward |
27:40 |
27:36 |
9.3 |
29 |
10 |
|
26:19 |
26:17 |
9.3 |
17 |
11 |
|
1st Windward |
26:32 |
26:29 |
9.3 |
17 |
11 |
|
28:05 |
27:57 |
9.2 |
28 |
10 |
| 1st Leeward |
46:14 |
18:34 |
11.1 |
2 |
10 |
|
44:26 |
18:07 |
11.1 |
4 |
11 |
|
1st Leeward |
44:38 |
18:06 |
11.1 |
3 |
11 |
|
46:44 |
18:39 |
10.9 |
3 |
10 |
| 2nd Windward |
70:22 |
24:08 |
9.2 |
16 |
10 |
|
67:02 |
22:36 |
9.4 |
2 |
10 |
|
2nd Windward |
67:31 |
22:53 |
9.5 |
3 |
10 |
|
71:09 |
24:25 |
9.3 |
15 |
10 |
| Finish |
90:51 |
20:29 |
10.8 |
5 |
10 |
|
87:44 |
20:42 |
10.6 |
11 |
10 |
|
Finish |
88:07 |
20:36 |
10.7 |
12 |
10 |
|
91:33 |
20:24 |
10.9 |
5 |
10 |
|
|
|
|
|
|
|
|
|
|
|
|
|
|
|
|
|
|
|
|
|
|
|
|
|
| Race 3 |
|
|
|
|
|
|
|
|
|
|
|
|
Race 3 |
|
|
|
|
|
|
|
|
|
|
|
| MARK |
Elapsed Time |
Leg Time |
Avg. Speed |
Tacks/Gybes |
Wind |
|
Elapsed Time |
Leg Time |
Avg. Speed |
Tacks/Gybes |
Wind |
|
MARK |
Elapsed Time |
Leg Time |
Avg. Speed |
Tacks/Gybes |
Wind |
|
Elapsed Time |
Leg Time |
Avg. Speed |
Tacks/Gybes |
Wind |
| Start |
0:03 |
- |
- |
- |
|
|
0:01 |
- |
- |
- |
|
|
Start |
0:02 |
- |
- |
- |
|
|
0:03 |
- |
- |
- |
|
| 1st Windward |
24:23 |
24:20 |
9.7 |
3 |
11 |
|
24:12 |
24:11 |
9.6 |
5 |
12 |
|
1st Windward |
23:43 |
23:41 |
9.6 |
2 |
12 |
|
24:37 |
24:34 |
9.7 |
3 |
11 |
| 1st Leeward |
42:59 |
18:36 |
10.7 |
4 |
11 |
|
42:48 |
18:36 |
10.8 |
9 |
12 |
|
1st Leeward |
42:24 |
18:41 |
10.7 |
8 |
12 |
|
43:07 |
18:30 |
10.7 |
2 |
11 |
| 2nd Windward |
65:27 |
22:28 |
9.7 |
8 |
13 |
|
65:25 |
22:37 |
9.7 |
9 |
13 |
|
2nd Windward |
64:40 |
22:16 |
9.6 |
8 |
13 |
|
66:11 |
23:04 |
9.6 |
10 |
13 |
| Finish |
85:06 |
19:39 |
11 |
3 |
12 |
|
84:48 |
19:23 |
11.3 |
8 |
13 |
|
Finish |
84:17 |
19:37 |
11.1 |
8 |
13 |
|
86:20 |
20:09 |
10.9 |
5 |
12 |
|
|
|
|
|
|
|
|
|
|
|
|
|
|
|
|
|
|
|
|
|
|
|
|
|
| Race 2 |
|
|
|
|
|
|
|
|
|
|
|
|
Race 2 |
|
|
|
|
|
|
|
|
|
|
|
| MARK |
Elapsed Time |
Leg Time |
Avg. Speed |
Tacks/Gybes |
Wind |
|
Elapsed Time |
Leg Time |
Avg. Speed |
Tacks/Gybes |
Wind |
|
MARK |
Elapsed Time |
Leg Time |
Avg. Speed |
Tacks/Gybes |
Wind |
|
Elapsed Time |
Leg Time |
Avg. Speed |
Tacks/Gybes |
Wind |
| Start |
0:03 |
- |
- |
- |
|
|
0:06 |
- |
- |
- |
|
|
Start |
0:15 |
- |
- |
- |
|
|
0:10 |
- |
- |
- |
|
| 1st Windward |
25:01 |
24:58 |
9.6 |
7 |
12 |
|
25:13 |
25:07 |
9.4 |
7 |
14 |
|
1st Windward |
26:11 |
25:56 |
9.5 |
11 |
14 |
|
26:16 |
26:06 |
9.6 |
7 |
12 |
| 1st Leeward |
43:44 |
18:43 |
10.7 |
4 |
13 |
|
43:48 |
18:35 |
11 |
2 |
13 |
|
1st Leeward |
44:08 |
17:57 |
11.3 |
5 |
13 |
|
44:48 |
18:32 |
10.9 |
4 |
13 |
| 2nd Windward |
66:33 |
22:49 |
9.6 |
6 |
12 |
|
67:16 |
23:28 |
9.3 |
8 |
12 |
|
2nd Windward |
67:30 |
23:22 |
9.3 |
9 |
12 |
|
67:41 |
22:53 |
9.7 |
6 |
12 |
| Finish |
86:44 |
20:11 |
10.7 |
4 |
12 |
|
88:12 |
20:56 |
10.5 |
5 |
11 |
|
Finish |
87:59 |
20:29 |
10.8 |
5 |
11 |
|
87:24 |
19:43 |
11 |
4 |
12 |
|
|
|
|
|
|
|
|
|
|
|
|
|
|
|
|
|
|
|
|
|
|
|
|
|
| Race 1 |
|
|
|
|
|
|
|
|
|
|
|
|
Race 1 |
|
|
|
|
|
|
|
|
|
|
|
| MARK |
Elapsed Time |
Leg Time |
Avg. Speed |
Tacks/Gybes |
Wind |
|
Elapsed Time |
Leg Time |
Avg. Speed |
Tacks/Gybes |
Wind |
|
MARK |
Elapsed Time |
Leg Time |
Avg. Speed |
Tacks/Gybes |
Wind |
|
Elapsed Time |
Leg Time |
Avg. Speed |
Tacks/Gybes |
Wind |
| Start |
0:02 |
- |
- |
- |
|
|
0:02 |
- |
- |
- |
|
|
Start |
0:03 |
- |
- |
- |
|
|
0:02 |
- |
- |
- |
|
| 1st Windward |
23:57 |
23:55 |
10.3 |
5 |
11 |
|
24:43 |
24:41 |
9.7 |
5 |
7 |
|
1st Windward |
25:35 |
25:32 |
9.6 |
5 |
7 |
|
25:00 |
24:58 |
10.2 |
5 |
11 |
| 1st Leeward |
43:24 |
19:27 |
10.3 |
3 |
8 |
|
44:41 |
19:58 |
10.2 |
5 |
12 |
|
1st Leeward |
44:48 |
19:13 |
10.8 |
4 |
12 |
|
44:05 |
19:05 |
10.4 |
3 |
8 |
| 2nd Windward |
64:57 |
21:33 |
9.8 |
9 |
13 |
|
65:21 |
20:40 |
9.7 |
5 |
11 |
|
2nd Windward |
66:42 |
21:54 |
9.8 |
2 |
11 |
|
65:27 |
21:22 |
9.8 |
9 |
13 |
| Finish |
83:52 |
18:55 |
11.3 |
6 |
8 |
|
85:12 |
19:51 |
10.5 |
4 |
5 |
|
Finish |
87:31 |
20:49 |
10.7 |
3 |
5 |
|
84:35 |
19:08 |
11.1 |
6 |
8 |
|
|
|
|
|
|
|
|
|
|
|
|
|
|
|
|
|
|
|
|
|
|
|
|
|
|
Emirates TNZ |
|
|
Luna Rossa |
|
|
|
|
Oracle BMW |
|
Desafio Espanol |
| Averages |
Leg Time |
Avg. Speed |
Tacks/Gybes |
Wind |
|
|
Leg Time |
Avg. Speed |
Tacks/Gybes |
Wind |
|
Averages |
Leg Time |
Avg. Speed |
Tacks/Gybes |
Wind |
|
|
Leg Time |
Avg. Speed |
Tacks/Gybes |
Wind |
| Upwind |
|
24:34 |
9.52 |
11.17 |
11.33 |
Upwind |
24:08 |
9.43 |
7.92 |
11.00 |
|
Upwind |
|
24:27 |
9.43 |
8.25 |
11.00 |
Upwind |
24:56 |
9.52 |
11.08 |
11.33 |
|
|
|
|
|
|
|
|
|
|
|
|
|
|
|
|
|
|
|
|
|
|
|
|
|
| Downwind |
20:00 |
10.56 |
3.50 |
12.90 |
Downwind |
19:58 |
10.70 |
6.17 |
12.90 |
|
Downwind |
20:01 |
10.81 |
6.33 |
12.90 |
Downwind |
20:02 |
10.57 |
3.67 |
12.90 |
|
|
|
|
|
|
|
|
|
|
|
|
|
|
|
|
|
|
|
|
|
|
|
|
|
| Race Time |
89:11 |
|
|
|
Race Time |
88:18 |
|
|
|
|
Race Time |
89:03 |
|
|
|
Race Time |
89:59 |
|
|
|
|
|
|
|
|
|
|
|
|
|
|
|
|
|
|
|
|
|
|
|
|
|
|
|
|
| Adjusted |
|
89:07 |
|
|
|
Adjusted |
88:12 |
|
|
|
|
Adjusted |
|
88:56 |
|
|
|
Adjusted |
89:55 |
|
|
|
| (minus start time) |
|
|
|
|
(minus start time) |
|
|
|
|
(minus start time) |
|
|
|
|
(minus start time) |
|
|
|
| |
|
|
|
|
|
|
|
|
|
|
|
|
|
|
|
|
|
|
|
|
|
|
|
|
| Other Stats: |
Upwind |
|
|
|
|
|
|
|
|
Downwind |
|
|
|
|
|
|
|
|
|
|
|
| (Avg.for all 4 boats) |
Average boat speed (knots) |
|
9.47 |
|
|
Average boat speed (knots) |
|
10.66 |
|
|
|
|
|
|
|
|
|
Average boat speed (meters/second) |
4.87 |
|
|
Average boat speed (meters/second) |
5.48 |
|
|
|
|
|
|
|
|
|
Time for 1 boatlength |
|
|
|
|
|
Time for 1 boatlength |
|
|
|
|
|
|
|
|
|
|
|
|
(i.e.25meters) in seconds |
|
|
5.13 |
|
|
(i.e.25meters) in seconds |
|
4.56 |
|
|
|
|
|
|
|
|
|
|
|
|
|
|
|
|
|
|
|
|
|
|
|
|
|
|
|
|
|
|
|
|
|
|
Average leg length (direct nm) |
3.30 |
|
|
Average leg length (direct nm) |
|
3.30 |
|
|
|
|
|
|
|
|
|
|
|
|
|
|
|
|
|
|
|
|
|
|
|
|
|
|
|
|
|
|
|
|
| Discussion |
|
|
|
|
|
|
|
|
|
|
|
|
|
|
|
|
|
|
|
|
|
|
|
|
The statistics show that in the 6 Semi Final races that data has been accumulated for: |
|
|
|
|
|
|
|
|
|
|
|
|
|
|
|
|
|
|
|
|
|
|
|
|
|
|
|
|
|
|
|
|
|
|
|
| Upwind |
ETNZ's boatspeed was 0.09kn faster upwind than Luna Rossa, although L.R. reached the top mark 26 seconds earlier, |
|
|
|
|
|
|
(or about 5 boat lengths) however ETNZ had an average of 3.25 extra tacks per leg (42% more) and seemed to cover and attack more. |
|
|
|
| Downwind |
ETNZ's boatspeed was 0.14kn slower downwind than Luna Rossa with L.R. completing an average of 2.2 (43%) more gybes per leg, however |
|
|
|
all 4 boats were only separated in avg. downwind leg time by 4 seconds (less than a boat length) possibly suggesting different pointing angles |
|
|
and more even VMG's (Velocity Made Good, i.e.- Speed toward the Mark) |
|
|
|
|
|
|
|
|
|
|
|
|
|
|
|
|
|
|
|
|
|
|
|
|
|
|
|
|
|
|
|
|
|
|
|
|
|
n.b.- The differences in average windspeed should be given less weight as the raw data is not accurate enough to |
|
|
|
|
|
|
|
be reliable. Readings were for averages over the course, not from individual boats. |
|
|
|
|
|
|
|
|
|
|
|
Also, being whole numbers,10.6 knots and 11.4 knots would both be shown as 11knots, increasing inaccuracy |
|
|
|
|
|
|
|
|
It may be more accurate to assume that as the races were sailed on the same courses with the second starting after a 10min delay |
|
|
|
|
|
|
that windspeeds were similar overall between races |
|
|
|
|
|
|
|
|
|
|
|
|
|
|
|
|
|
|
|
|
|
|
|
|
|
|
|
|
|
|
|
|
|
|
|
|
|
|
|
|
If you want to link to this article then please use this URL: www.sail-world.com/34193