What is an El Niño and how will it affect my sailing? (Part 1)
by NOAA/Sail-World Cruising on 28 Jun 2014
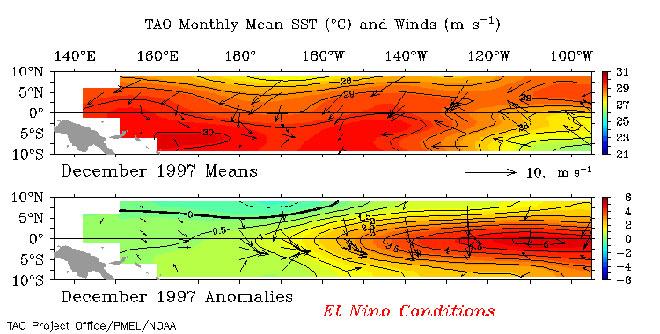
El Niño (warm) Conditions - December 1997 NOAA .
http://www.noaanews.noaa.gov/
El Niño is characterized by unusually warm ocean temperatures in the Equatorial Pacific, as opposed to La Niña, which characterized by unusually cold ocean temperatures in the Equatorial Pacific. El Niño is an oscillation of the ocean-atmosphere system in the tropical Pacific having important consequences for weather around the globe. But what will it actually mean for cruising sailors?
El Niño and La Niña - the background, the facts and the research:
El Niño was originally recognized by fisherman off the coast of South America as the appearance of unusually warm water in the Pacific ocean, occurring near the beginning of the year. El Niño means The Little Boy or Christ child in Spanish. This name was used for the tendency of the phenomenon to arrive around Christmas.
La Niña means The Little Girl. La Niña is sometimes called El Viejo, anti-El Niño, or simply 'a cold event' or 'a cold episode'. El Niño is often called 'a warm event'.
Among these consequences are increased rainfall across the southern tier of the US and in Peru, which has caused destructive flooding, and drought in the West Pacific, sometimes associated with devastating bush fires in Australia. Observations of conditions in the tropical Pacific are considered essential for the prediction of short term (a few months to one year) climate variations.
To provide necessary data, NOAA operates a network of buoys which measure temperature, currents and winds in the equatorial band. These buoys daily transmit data which are available to researchers and forecasters around the world in real time.
Note: Until 1997, the 1982-1983 El Niño, was the largest El Niño of the twentieth century. These two important El Niño events are used for illustrations in this web page.
In normal, non-El Niño conditions (top panel of schematic diagram), the trade winds blow towards the west across the tropical Pacific. These winds pile up warm surface water in the west Pacific, so that the sea surface is about 1/2 meter higher at Indonesia than at Ecuador.
The sea surface temperature is about eight degrees C higher in the west, with cool temperatures off South America, due to an upwelling of cold water from deeper levels. This cold water is nutrient-rich, supporting high levels of primary productivity, diverse marine ecosystems, and major fisheries. Rainfall is found in rising air over the warmest water, and the east Pacific is relatively dry. The observations at 110 W (left diagram of 110 W conditions) show that the cool water (below about 17 degrees C, the black band in these plots) is within 50m of the surface.
During El Niño (bottom panel of the schematic diagram), the trade winds relax in the central and western Pacific leading to a depression of the thermocline (transitional water layer) in the eastern Pacific, and an elevation of the thermocline in the west. The observations at 110W show, for example, that during 1982-1983, the 17-degree isotherm dropped to about 150m depth.
This reduced the efficiency of upwelling to cool the surface and cut off the supply of nutrient rich thermocline water to the euphotic(receives enough sunlight for photosynthesis) zone. The result was a rise in sea surface temperature and a drastic decline in primary productivity, the latter of which adversely affected higher trophic levels of the food chain, including commercial fisheries in this region. The weakening of easterly tradewinds during El Niño is evident in this figure as well. Rainfall follows the warm water eastward, with associated flooding in Peru and drought in Indonesia and Australia. The eastward displacement of the atmospheric heat source overlaying the warmest water results in large changes in the global atmospheric circulation, which in turn force changes in weather in regions far removed from the tropical Pacific
Recognizing El Niño
El Niño can be seen in Sea Surface Temperature in the Equatorial Pacific Ocean
El Niño can be seen in measurements of the sea surface temperature, such as those shown above, which were made from the TAO Array of moored buoys. In December 1993, the sea surface temperatures and the winds were near normal, with warm water in the Western Pacfic Ocean (in red on the top panel of December 1993 plot), and cool water, called the 'cold tongue' in the Eastern Pacific Ocean (in green on the top panel of the December 1993 plot). The winds in the Western Pacific are very weak (see the arrows pointing in the direction the wind is blowing towards), and the winds in the Eastern Pacific are blowing towards the west (towards Indonesia). The bottom panel of the December 1993 plot shows anomalies, the way the sea surface temperature and wind differs from a normal December. In this plot, the anomalies are very small (yellow/green), indicating a normal December. December 1997 was near the peak of a strong El Niño year. In December 1997, the warm water (red in the top panel of the December 1997 plot) has spread from the western Pacific Ocean towards the east (in the direction of South America), the 'cold tongue' (green color in the top panel of the December 1997 plot) has weakened, and the winds in the western Pacific, usually weak, are blowing strongly towards the east, pushing the warm water eastward. The anomalies show clearly that the water in the center of Pacific Ocean is much warmer (red) than in a normal December.
December 1998 was a strong La Niña (cold) event. The cold tongue (blue) is cooler than usual by about 3° Centigrade. The cold La Niña events sometimes (but not always) follow El Niño events.
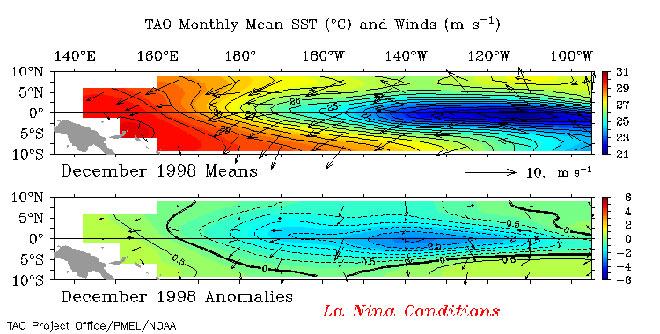
La Niña (cold) Conditions - December 1998 © NOAA . Also see the entire Pacific Ocean
Animation of El Niño
Animation of physical processes allow scientists to better understand El Niño
You can view an animation of El Niño which shows the changes in monthly sea surface temperature in the tropical Pacific Ocean. As you view this animation, you will see the warm water spreading from the western Pacific to the eastern Pacific during 1997. The bottom panel in the animation, labeled anomalies, shows how much the sea surface temperature for each month is different from the long term average for that month. The red color in the anomalies plot indicates that the temperature of the water is much warmer than is normal for that month. Blue color indicates that the water is much cooler than is normal for that month.
http://www.pmel.noaa.gov/
So after all that, how will it affect sailors?
Tropical cyclones:
Most tropical cyclones form on the side of the subtropical ridge closer to the equator, then move poleward past the ridge axis before recurving into the main belt of the Westerlies.[20] When the subtropical ridge position shifts due to El Niño, so will the preferred tropical cyclone tracks. Areas west of Japan and Korea tend to experience much fewer September–November tropical cyclone impacts during El Niño and neutral years. During El Niño years, the break in the subtropical ridge tends to lie near 130°E, which would favor the Japanese archipelago.[21] During El Niño years, Guam's chance of a tropical cyclone impact is one-third of the long-term average.[22] The tropical Atlantic ocean experiences depressed activity due to increased vertical wind shear across the region during El Niño years.[23] On the flip side, however, the tropical Pacific Ocean east of the dateline has above-normal activity during El Niño years due to water temperatures well above average and decreased windshear.[24] Most of the recorded East Pacific category 5 hurricanes occur during El Niño years in clusters.
Atlantic:
El Niño is credited with suppressing hurricanes, and made the 2009 hurricane season the least active in 12 years. There is also a generally accepted link between any less-than-'normally' active Atlantic hurricane season and the notably warm event that characterises the El Nino.
Europe:
El Niño's effects tend to be 12-18 months behind those in the Pacific. The effect on European waters appear to be strongest in winter. Recent evidence indicates that El Niño causes a colder, drier winter in Northern Europe and a milder, wetter winter in Southern Europe. However, researchers are cautious about attributing a direct causal link.
Pacific:
It is in the Pacific Ocean where the strongest evidence exists. As the El Niño event begins,
the easterlies relax, reducing the amount of upwelling and allowing the western warm water to move eastward. As time goes on, the warm pool in the western Pacific grows and expands eastward toward the central Pacific (figure 2). Detailed monitoring of recorded El Niño episodes has revealed that once the warmest water reaches the International Date Line, anomalous convection usually appears in that region, accompanied by a weakening of the equatorial easterlies. This pattern typically occurs during the winter (June–August) and may be preceded or followed by a warming that causes the
Inter-Tropical Convergence Zone (ITCZ) to move farther south than normal, which contributes to enhanced rainfall across Ecuador and northern Peru, producing the 'years of abundance.'
However, having quoted all that from the 'experts', an old cruising buddy of mine Don Radcliffe summed it up brilliantly
I went across the South Pacific twice--once in an El Nino year. I had too much wind, too little wind, just right wind, rain, sunny days, wind the wrong direction, cyclone threats--both times. I had a fantastic trip--both times!
If you want to link to this article then please use this URL: www.sail-world.com/123827

-202504070859.gif)